Negative News, Positive Markets
Share This Insight
Institutional investors oversee the vast majority of stocks and bonds, and have a significant influence on market price movements. These institutions include pensions, mutual funds, insurance companies, and large endowments. But unlike most individual investors, these professional asset managers’ market sentiment is not based on the latest headlines.
While they can’t tell the future, these asset managers do their best to project the direction of the economy and corporate earnings by digesting data from every possible source. They hire analysts to study corporate balance sheets and interview CFOs. They hire political consultants and macroeconomic forecasters, and use satellite images of retail parking lots to determine the volume of shoppers. They study charts and hunt for technical trends using trained experts and algorithms powered by supercomputers, all to gain an edge and determine where the market may be headed.
Even with all of their research, professional investors often misprice assets and can be surprised by new information. Unexpected events and data are often what drive the markets dramatically higher and lower…even if that information doesn’t make it to the everyday news cycle. For example, let’s say two data points are released on the same day. First, the Institute of Supply Management releases a report that shows manufacturing data increased much faster than expected during the prior month. Later that day, a highly populated state reports a record number of daily positive COVID-19 tests. Which item is more likely to make the headlines? Which matters more in terms of economic growth and corporate earnings (the drivers of stock prices)?
This disparity between media and market reality has been playing out since late March. Virus numbers, economic data, and corporate earnings have been consistently better than projected. There were fewer job losses, and fewer COVID deaths than originally projected. Over 80% of S&P 500 companies that reported second-quarter earnings beat their estimates. Our own weekly analysis shows a steady increase in the projected earnings for 2021. After racing to price in a near doomsday scenario in March, the stock market has digested this positive information and stock prices are rising.
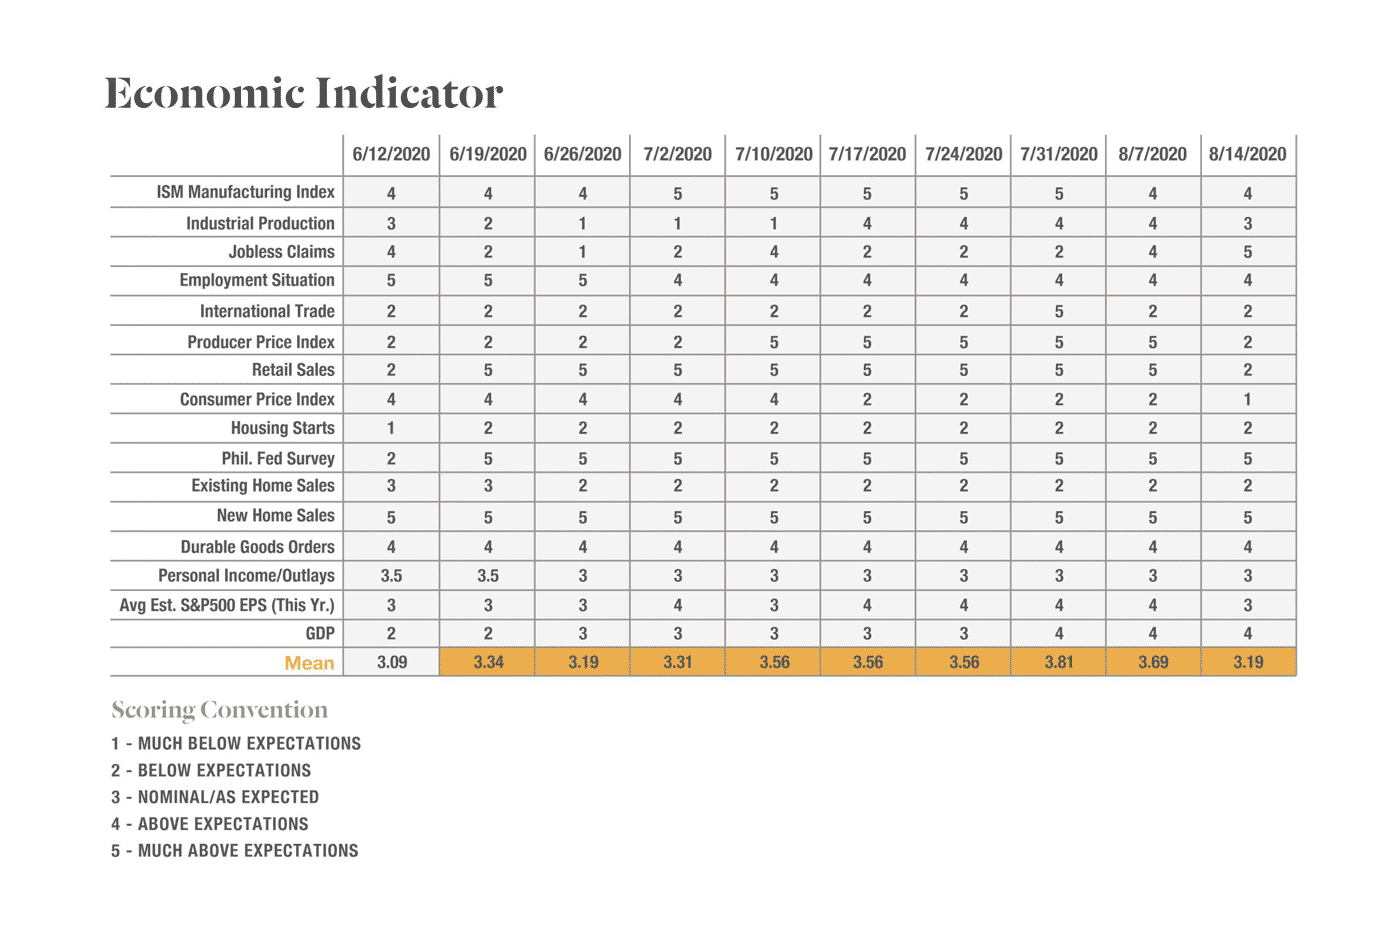
We summarize this sort of economic data at John Moore during our weekly Investment Committee meetings, and rate data relative to expectations as new information is released. A 3 means new information is within expectations, 2 or 1 means the data is disappointing, while 4 or 5 means the data is a positive surprise. The chart below illustrates that data has steadily come in higher than expected. The economy is exceeding expectations, but nobody is talking about it.
The media isn’t always the best predictor of the market. Just like the weatherman, predicted rain doesn’t always fall. An experienced and diligent financial advisor can help keep you informed about what to pay attention to and help you make informed decisions, regardless of what’s published on today’s front page.
Opinions are those of the author, and there is no guarantee that these statements, opinions, or forecasts provided herein will prove to be correct. Past performance doesn't guarantee future results. Investing involves risk, regardless of the strategy selected.
The S&P 500 is an unmanaged index of 500 widely held stocks that are generally considered representative of the U.S. stock market. You cannot invest directly in any index.
Subscribe for More Financial Insights
Never miss a post. Receive notifications by email whenever we post a new JMA Insight.