The Flat Road Ahead
Share This Insight
The market has a way of sorting itself out.
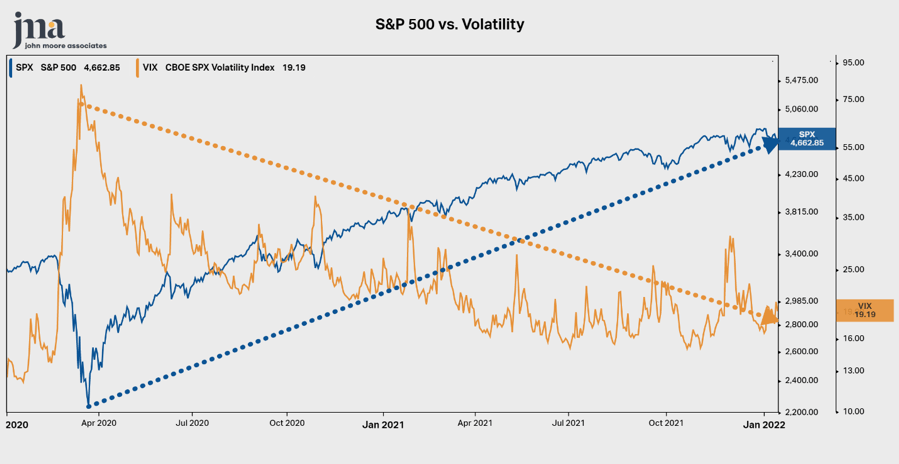
Take the last two years as an example. In 2020, we watched the stock market drop 34% in less than a month, bottoming out on March 23rd. This marked the largest drop since the Great Recession in 2008-2009, and some of the worst individual trading days of all time.
Since then, we have seen a meteoric rise in the market (blue line) and a steady decline in volatility (orange line). It took only five months for the market to make back all of its COVID losses. Then, in 2021, the market notched 70 all-time highs on its way to a 26.9% return for the year.

Source: www.koyfin.com
But that’s all in the rearview mirror. What might the road ahead look like?
I’m so glad you asked.
We cannot predict the future, but we can keep our eye on the horizon, processing new data as it arrives, and preparing for the most likely outcomes. So what is the data telling us?
Growth is Slowing – Expect More Volatility
Corporations and the economy are experiencing slower growth. If you have spent any time around JMA, you’ve heard us say it: Earnings drive stock prices. While corporate earnings are expected to continue to grow, they are expected to grow slower than they did in 2021. This is not surprising, because 2021 had a remarkably steep recovery, which was led by skyrocketing corporate earnings growth.
To measure our country’s growth, we look at Gross Domestic Product. Like company earnings, GDP is projected to grow slower as well. Growth is good for the economy and for the market, but slower growth can actually be a headwind.
Markets Are Ahead of the Trend – Expect Below-Average Returns
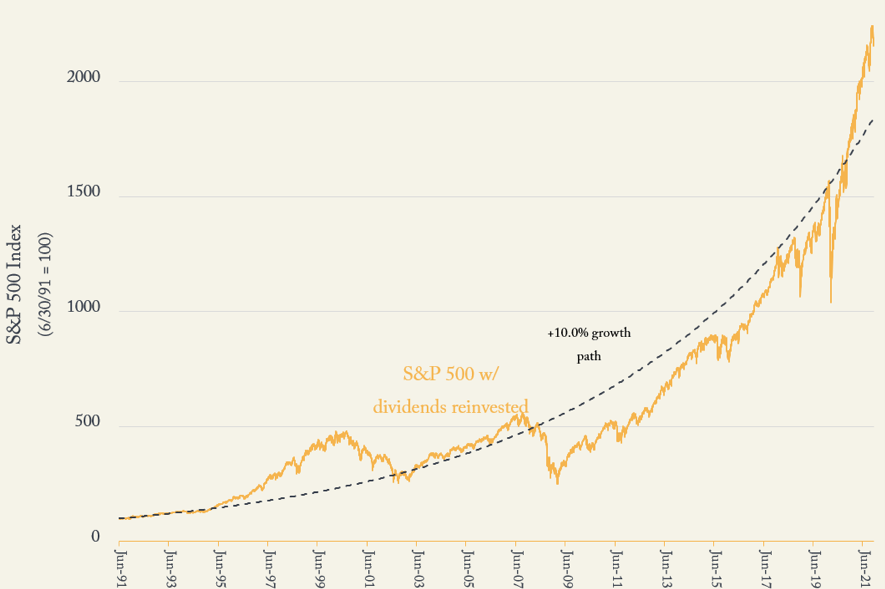
For over a year now, markets have been ahead of the trend. The chart below shows the last 30 years of the S&P 500 (orange line) as compared to the long-term trend of 10%/year (blue dotted line). As of January 18th, we are 12.5% ahead of long-term trend.

Source: Standard and Poor’s. Data through January 4, 2022.1 Compound annual growth rate. 2 S&P 500 total return index. 3 per Professor Jeremy Siegel’s seminal Stocks for the Long Run, first published in 1994.
As we like to say, the trend is your friend. At some point, the market will reunite with its long-lost amigo. This could happen in two ways:
- A sharp decline, such as a 10-15% correction, or
- A flat market for the next 6-12 months
Either of these scenarios would be equally plausible in our view, especially considering underlying economic data.
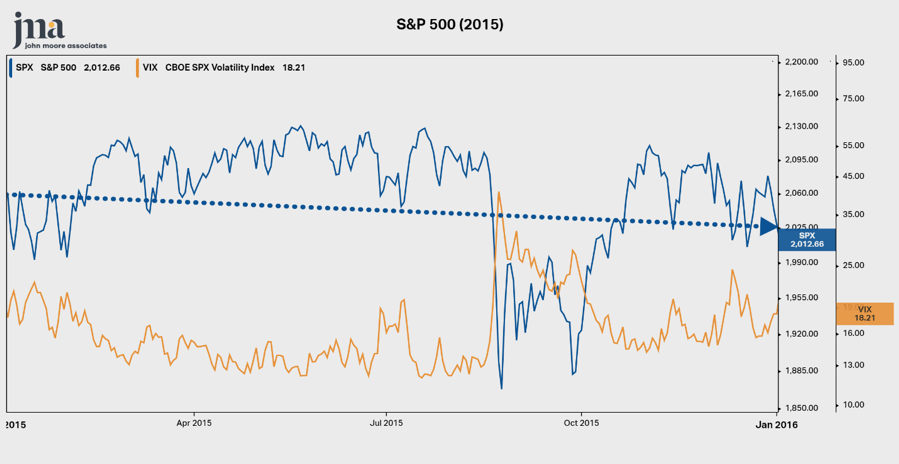
Curious about what a flat market looks like? I’ll leave you with this example from 2015.

Source: www.koyfin.com
Our opinions are rooted in data and shaped by experience, but we will never claim to predict the future. Rather, we rely on our process to be proactive when the data gives us clues as to what might be up ahead. The road behind us has been smooth and steep, but the road ahead appears to be flat and bumpy. Road conditions could change, but it is always best to prepare for what’s on the horizon.
Subscribe for More Financial Insights
Never miss a post. Receive notifications by email whenever we post a new JMA Insight.
